Top Rankings
Richmond Community Schools School District ranks among the top 20% of public school district in Indiana for:
Category
Attribute
Community Size
Largest student body (number of students) (Top 1%)
Student Attention
Lowest student:teacher ratio (Top 1%)
For the 2025 school year, there are 2 public high schools serving 1,398 students in Richmond Community Schools School District. This district's average high testing ranking is 3/10, which is in the bottom 50% of public high schools in Indiana.
Public High Schools in Richmond Community Schools School District have an average math proficiency score of 14% (versus the Indiana public high school average of 29%), and reading proficiency score of 38% (versus the 46% statewide average).
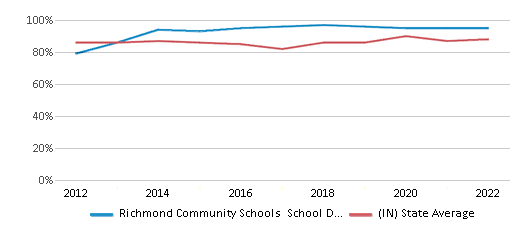
Public High School in Richmond Community School School District have a Graduation Rate of 95%, which is more than the Indiana average of 88%.
The school with highest graduation rate is Richmond High School, with 95% graduation rate. Read more about public school graduation rate statistics in Indiana or national school graduation rate statistics.
Minority enrollment is 38% of the student body (majority Hispanic), which is more than the Indiana public high school average of 36% (majority Hispanic and Black).
Overview
This School District
This State (IN)
# Schools
10 Schools
486 Schools
# Students
4,481 Students
357,980 Students
# Teachers
335 Teachers
23,187 Teachers
Student : Teacher Ratio
13:1
13:1
District Rank
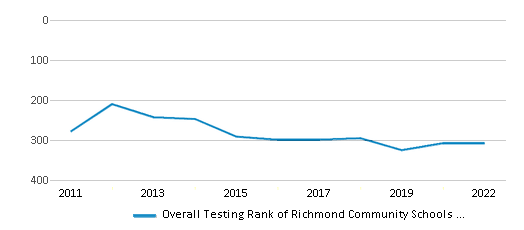
Richmond Community Schools School District, which is ranked within the bottom 50% of all 394 school districts in Indiana (based off of combined math and reading proficiency testing data) for the 2021-2022 school year.
The school district's graduation rate of 95% has decreased from 96% over five school years.
Overall District Rank
#308 out of 400 school districts
(Bottom 50%)
(Bottom 50%)
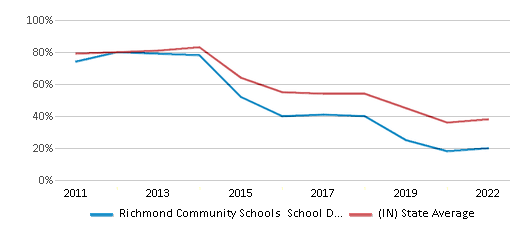
Math Test Scores (% Proficient)
20%
38%
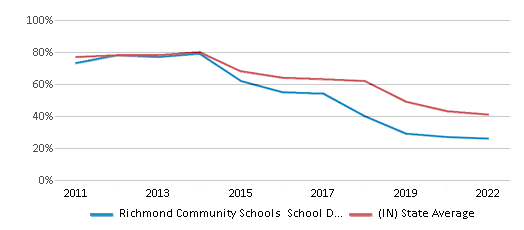
Reading/Language Arts Test Scores (% Proficient)
26%
41%
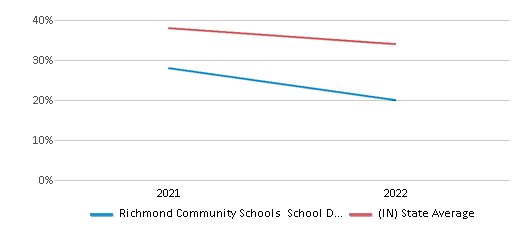
Science Test Scores (% Proficient)
20%
34%
Graduation Rate
95%
88%
Students by Ethnicity:
Diversity Score
0.58
0.55
# American Indian Students
21 Students
616 Students
% American Indian Students
1%
n/a
# Asian Students
51 Students
9,609 Students
% Asian Students
1%
3%
# Hispanic Students
551 Students
52,018 Students
% Hispanic Students
12%
14%
# Black Students
400 Students
48,550 Students
% Black Students
9%
14%
# White Students
2,743 Students
229,391 Students
% White Students
61%
64%
# Hawaiian Students
5 Students
355 Students
% Hawaiian Students
n/a
n/a
# Two or more races Students
710 Students
17,441 Students
% of Two or more races Students
16%
5%
Students by Grade:
# Students in PK Grade:
231
470
# Students in K Grade:
340
977
# Students in 1st Grade:
344
1,069
# Students in 2nd Grade:
320
1,085
# Students in 3rd Grade:
301
1,128
# Students in 4th Grade:
306
1,106
# Students in 5th Grade:
332
1,181
# Students in 6th Grade:
301
3,024
# Students in 7th Grade:
328
10,217
# Students in 8th Grade:
327
10,906
# Students in 9th Grade:
378
80,749
# Students in 10th Grade:
353
82,602
# Students in 11th Grade:
314
81,106
# Students in 12th Grade:
295
79,954
# Ungraded Students:
11
2,406
District Revenue and Spending
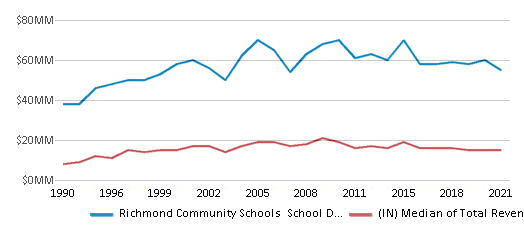
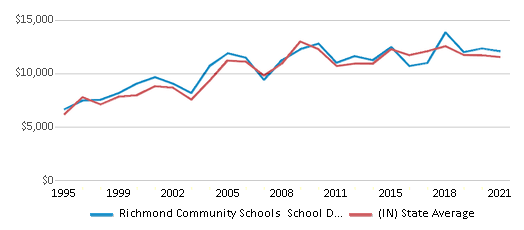
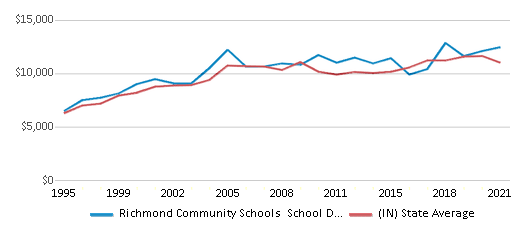
The revenue/student of $12,324 in this school district is less than the state median of $13,214. The school district revenue/student has stayed relatively flat over four school years.
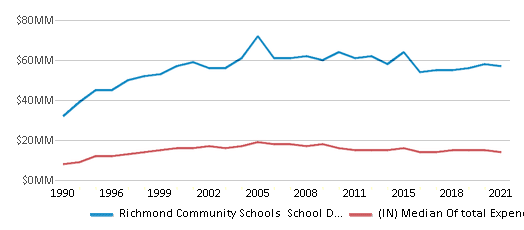
The school district's spending/student of $12,706 is less than the state median of $12,844. The school district spending/student has stayed relatively flat over four school years.
Total Revenue
$55 MM
$13,615 MM
Spending
$57 MM
$13,234 MM
Revenue / Student
$12,324
$13,214
Spending / Student
$12,706
$12,844
Best Richmond Community Schools School District Public High Schools (2025)
School
(Math and Reading Proficiency)
(Math and Reading Proficiency)
Location
Grades
Students
Rank: #11.
Richmond High School
(Math: 14% | Reading: 38%)
Rank:
Rank:
3/
Bottom 50%10
380 Hub Etchison Pky
Richmond, IN 47374
(765) 973-3424
Richmond, IN 47374
(765) 973-3424
Grades: 9-12
| 1,331 students
Rank: #22.
Community Youth Services
Special Education School
(Math: ≤5% | Reading: ≤5% )
Rank:
Rank:
1/
Bottom 50%10
315 Nw 3rd St
Richmond, IN 47374
(765) 973-3430
Richmond, IN 47374
(765) 973-3430
Grades: K-12
| 67 students
Recent Articles

Navigating Special Needs Education: A Comprehensive Guide for Parents and Educators
We explore special needs in children, including learning disabilities, autism, and ADHD. We suggest some insights on diagnosis, support strategies, and educational approaches, empowering parents and educators to provide effective assistance to children with special needs.

Sexual Harassment at Age 6: The Tale of a First Grade Suspension
A six-year old in Aurora, Colorado, was suspended after singing an LMFAO song to a little girl in his class and reportedly 鈥渟haking his booty.鈥� We look at the case and the sexual harassment problem in public schools today.

February 05, 2025
Understanding the U.S. Department of Education: Structure, Impact, and EvolutionWe explore how the Department of Education shapes American education, from its cabinet-level leadership to its impact on millions of students, written for general audiences seeking clarity on this vital institution.


