For the 2025 school year, there are 45 public elementary schools serving 26,715 students in Harford County School District. This district's average elementary testing ranking is 7/10, which is in the top 50% of public elementary schools in Maryland.
Public Elementary Schools in Harford County School District have an average math proficiency score of 26% (versus the Maryland public elementary school average of 24%), and reading proficiency score of 48% (versus the 44% statewide average).
Minority enrollment is 42% of the student body (majority Black), which is less than the Maryland public elementary school average of 68% (majority Black).
Overview
This School District
This State (MD)
# Schools
55 Schools
1,156 Schools
# Students
38,105 Students
615,932 Students
# Teachers
2,684 Teachers
44,217 Teachers
Student : Teacher Ratio
14:1
14:1
District Rank
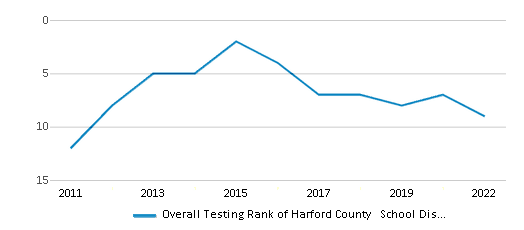
Harford County School District, which is ranked within the top 50% of all 25 school districts in Maryland (based off of combined math and reading proficiency testing data) for the 2021-2022 school year.
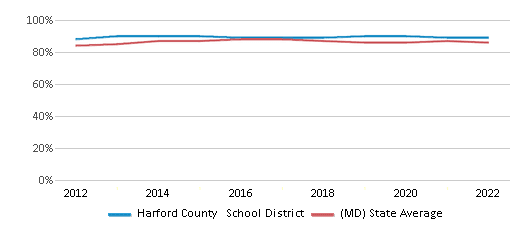
The school district's graduation rate of 89% has stayed relatively flat over five school years.
Overall District Rank
#9 out of 25 school districts
(Top 50%)
(Top 50%)
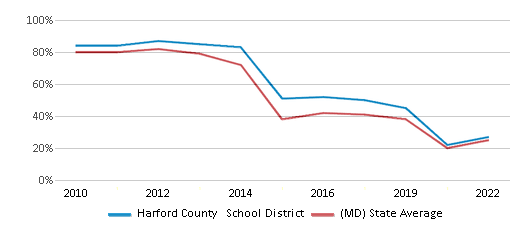
Math Test Scores (% Proficient)
27%
25%
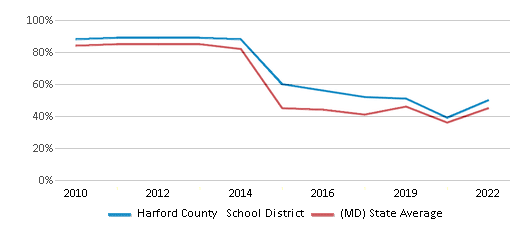
Reading/Language Arts Test Scores (% Proficient)
50%
45%
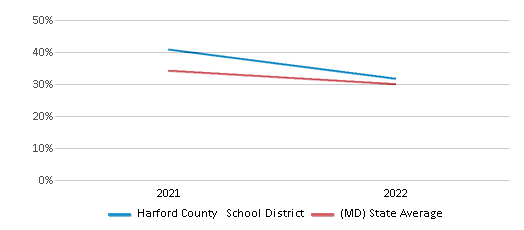
Science Test Scores (% Proficient)
38%
36%
Graduation Rate
89%
86%
Students by Ethnicity:
Diversity Score
0.61
0.74
# American Indian Students
85 Students
1,657 Students
% American Indian Students
n/a
n/a
# Asian Students
1,310 Students
41,188 Students
% Asian Students
4%
7%
# Hispanic Students
3,568 Students
141,475 Students
% Hispanic Students
9%
23%
# Black Students
8,062 Students
198,787 Students
% Black Students
21%
32%
# White Students
22,061 Students
197,041 Students
% White Students
58%
32%
# Hawaiian Students
48 Students
788 Students
% Hawaiian Students
n/a
n/a
# Two or more races Students
2,937 Students
34,835 Students
% of Two or more races Students
8%
6%
Students by Grade:
# Students in PK Grade:
1,126
29,446
# Students in K Grade:
2,628
60,269
# Students in 1st Grade:
2,821
63,130
# Students in 2nd Grade:
2,889
65,933
# Students in 3rd Grade:
2,819
64,137
# Students in 4th Grade:
2,857
65,488
# Students in 5th Grade:
2,718
65,328
# Students in 6th Grade:
2,822
64,624
# Students in 7th Grade:
2,844
65,201
# Students in 8th Grade:
2,827
65,415
# Students in 9th Grade:
3,217
2,068
# Students in 10th Grade:
3,027
1,833
# Students in 11th Grade:
2,820
1,526
# Students in 12th Grade:
2,690
1,534
# Ungraded Students:
-
-
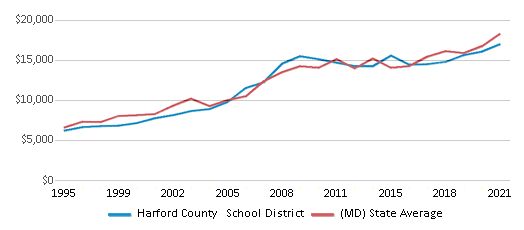
District Revenue and Spending
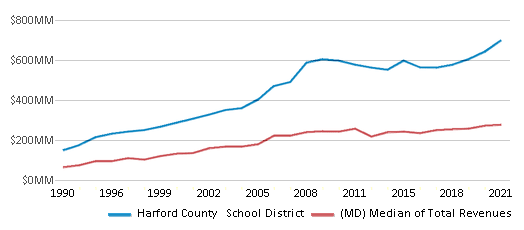
The revenue/student of $18,334 in this school district is less than the state median of $19,554. The school district revenue/student has stayed relatively flat over four school years.
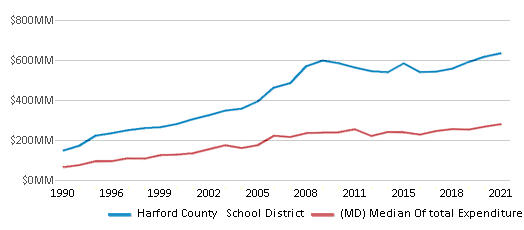
The school district's spending/student of $16,642 is less than the state median of $18,481. The school district spending/student has stayed relatively flat over four school years.
Total Revenue
$699 MM
$17,412 MM
Spending
$634 MM
$16,456 MM
Revenue / Student
$18,334
$19,554
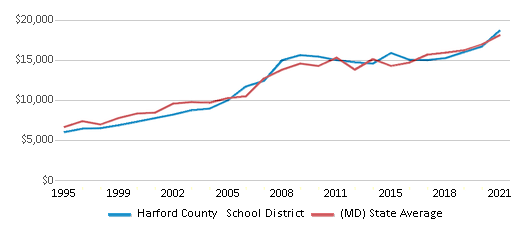
Spending / Student
$16,642
$18,481
Best Harford County School District Public Elementary Schools (2025)
School
(Math and Reading Proficiency)
(Math and Reading Proficiency)
Location
Grades
Students
Rank: #11.
Jarrettsville Elementary School
(Math: 60% | Reading: 72%)
Rank:
Rank:
10/
Top 10%10
3818 Norrisville Rd
Jarrettsville, MD 21084
(410) 692-7800
Jarrettsville, MD 21084
(410) 692-7800
Grades: K-5
| 476 students
Rank: #22.
Bel Air Elementary School
(Math: 57% | Reading: 71%)
Rank:
Rank:
10/
Top 10%10
30 E Lee St
Bel Air, MD 21014
(410) 638-4160
Bel Air, MD 21014
(410) 638-4160
Grades: PK-5
| 514 students
Rank: #33.
Ring Factory Elementary School
(Math: 57% | Reading: 69%)
Rank:
Rank:
10/
Top 10%10
1400 Emmorton Rd
Bel Air, MD 21014
(410) 638-4186
Bel Air, MD 21014
(410) 638-4186
Grades: K-5
| 544 students
Rank: #44.
Prospect Mill Elementary School
(Math: 52% | Reading: 68%)
Rank:
Rank:
9/
Top 20%10
101 Prospect Mill Rd
Bel Air, MD 21015
(410) 638-3817
Bel Air, MD 21015
(410) 638-3817
Grades: PK-5
| 592 students
Rank: #55.
Fountain Green Elementary School
(Math: 58% | Reading: 65%)
Rank:
Rank:
9/
Top 20%10
517 Fountain Green Rd
Bel Air, MD 21015
(410) 638-4220
Bel Air, MD 21015
(410) 638-4220
Grades: PK-5
| 456 students
Rank: #66.
Forest Lakes Elementary School
(Math: 55% | Reading: 65%)
Rank:
Rank:
9/
Top 20%10
100 Osborne Pkwy
Forest Hill, MD 21050
(410) 638-4262
Forest Hill, MD 21050
(410) 638-4262
Grades: K-5
| 420 students
Rank: #77.
Norrisville Elementary School
(Math: 50-54% | Reading: 60-64%)
Rank:
Rank:
9/
Top 20%10
5302 Norrisville Rd
White Hall, MD 21161
(410) 692-7810
White Hall, MD 21161
(410) 692-7810
Grades: K-5
| 213 students
Rank: #88.
Youths Benefit Elementary School
(Math: 49% | Reading: 64%)
Rank:
Rank:
9/
Top 20%10
1901 Fallston Rd
Fallston, MD 21047
(410) 638-4190
Fallston, MD 21047
(410) 638-4190
Grades: PK-5
| 1,114 students
Rank: #99.
Homestead/wakefield Elementary School
(Math: 44% | Reading: 67%)
Rank:
Rank:
9/
Top 20%10
900 S Main St
Bel Air, MD 21014
(410) 638-4175
Bel Air, MD 21014
(410) 638-4175
Grades: PK-5
| 1,057 students
Rank: #1010.
North Harford Elementary School
(Math: 40-44% | Reading: 65-69%)
Rank:
Rank:
9/
Top 20%10
120 Pylesville Rd
Pylesville, MD 21132
(410) 638-3670
Pylesville, MD 21132
(410) 638-3670
Grades: PK-5
| 404 students
Rank: #1111.
Darlington Elementary School
(Math: 40-49% | Reading: 60-69%)
Rank:
Rank:
9/
Top 20%10
2119 Shuresville Rd
Darlington, MD 21034
(410) 638-3700
Darlington, MD 21034
(410) 638-3700
Grades: K-5
| 92 students
Rank: #1212.
Hickory Elementary School
(Math: 44% | Reading: 62%)
Rank:
Rank:
9/
Top 20%10
2100 Conowingo Rd
Bel Air, MD 21014
(410) 638-4170
Bel Air, MD 21014
(410) 638-4170
Grades: K-5
| 664 students
Rank: #1313.
Red Pump Elementary School
(Math: 43% | Reading: 62%)
Rank:
Rank:
9/
Top 20%10
600 Red Pump Road
Bel Air, MD 21014
(410) 809-6244
Bel Air, MD 21014
(410) 809-6244
Grades: K-5
| 753 students
Rank: #1414.
North Bend Elementary School
(Math: 40-44% | Reading: 60-64%)
Rank:
Rank:
9/
Top 20%10
1445 N Bend Rd
Jarrettsville, MD 21084
(410) 692-7815
Jarrettsville, MD 21084
(410) 692-7815
Grades: PK-5
| 448 students
Rank: #1515.
Emmorton Elementary School
(Math: 37% | Reading: 66%)
Rank:
Rank:
9/
Top 20%10
2502 Tollgate Rd
Bel Air, MD 21014
(410) 638-3920
Bel Air, MD 21014
(410) 638-3920
Grades: K-5
| 556 students
Rank: #1616.
Forest Hill Elementary School
(Math: 47% | Reading: 58%)
Rank:
Rank:
9/
Top 20%10
2407 Rocks Rd
Forest Hill, MD 21050
(410) 638-4166
Forest Hill, MD 21050
(410) 638-4166
Grades: K-5
| 475 students
Rank: #1717.
Southampton Middle School
(Math: 32% | Reading: 62%)
Rank:
Rank:
8/
Top 30%10
1200 Moores Mill Rd
Bel Air, MD 21014
(410) 638-4150
Bel Air, MD 21014
(410) 638-4150
Grades: 6-8
| 1,194 students
Rank: #1818.
Churchville Elementary School
(Math: 35-39% | Reading: 55-59%)
Rank:
Rank:
8/
Top 30%10
2935 Level Rd
Churchville, MD 21028
(410) 638-3800
Churchville, MD 21028
(410) 638-3800
Grades: PK-5
| 376 students
Rank: #1919.
Center For Educational Opportunity
Alternative School
(Math: <50% | Reading: <50%)
Rank:
Rank:
8/
Top 30%10
253 Paradise Rd
Aberdeen, MD 21001
(410) 273-5594
Aberdeen, MD 21001
(410) 273-5594
Grades: 6-12
| 87 students
Rank: #2020.
Fallston Middle School
(Math: 28% | Reading: 62%)
Rank:
Rank:
8/
Top 30%10
2303 Carrs Mill Rd
Fallston, MD 21047
(410) 638-4129
Fallston, MD 21047
(410) 638-4129
Grades: 6-8
| 1,060 students
Rank: #2121.
Bel Air Middle School
(Math: 25% | Reading: 63%)
Rank:
Rank:
7/
Top 50%10
99 Idlewild Street
Bel Air, MD 21014
(410) 638-4140
Bel Air, MD 21014
(410) 638-4140
Grades: 6-8
| 1,080 students
Rank: #2222.
Meadowvale Elementary School
(Math: 29% | Reading: 58%)
Rank:
Rank:
7/
Top 50%10
910 Grace View Dr
Havre De Grace, MD 21078
(410) 939-6622
Havre De Grace, MD 21078
(410) 939-6622
Grades: PK-5
| 544 students
Rank: #2323.
Dublin Elementary School
(Math: 30-34% | Reading: 50-54%)
Rank:
Rank:
7/
Top 50%10
1527 Whiteford Rd
Street, MD 21154
(410) 638-3703
Street, MD 21154
(410) 638-3703
Grades: PK-5
| 216 students
Rank: #2424.
Havre De Grace Elementary School
(Math: 32% | Reading: 51%)
Rank:
Rank:
7/
Top 50%10
600 Juniata St
Havre De Grace, MD 21078
(410) 939-6616
Havre De Grace, MD 21078
(410) 939-6616
Grades: PK-5
| 603 students
Rank: #2525.
Patterson Mill Middle School
(Math: 26% | Reading: 54%)
Rank:
Rank:
7/
Top 50%10
85 Patterson Mill Rd
Bel Air, MD 21015
(410) 638-4640
Bel Air, MD 21015
(410) 638-4640
Grades: 6-8
| 767 students
Rank: #2626.
Abingdon Elementary School
(Math: 23% | Reading: 54%)
Rank:
Rank:
7/
Top 50%10
3001 S. Tollgate Road
Abingdon, MD 21009
(410) 638-3910
Abingdon, MD 21009
(410) 638-3910
Grades: PK-5
| 674 students
Rank: #2727.
North Harford Middle School
(Math: 23% | Reading: 52%)
Rank:
Rank:
6/
Top 50%10
112 Pylesville Rd
Pylesville, MD 21132
(410) 638-3658
Pylesville, MD 21132
(410) 638-3658
Grades: 6-8
| 867 students
Rank: #2828.
William S. James Elementary School
(Math: 31% | Reading: 45%)
Rank:
Rank:
6/
Top 50%10
1 Laurentum Pkw
Abingdon, MD 21009
(410) 638-3900
Abingdon, MD 21009
(410) 638-3900
Grades: K-5
| 475 students
Rank: #2929.
Roye-williams Elementary School
(Math: 26% | Reading: 40%)
Rank:
Rank:
6/
Top 50%10
201 Oakington Rd
Havre De Grace, MD 21078
(410) 273-5536
Havre De Grace, MD 21078
(410) 273-5536
Grades: PK-5
| 449 students
Rank: #3030.
Church Creek Elementary School
(Math: 29% | Reading: 36%)
Rank:
Rank:
5/
Bottom 50%10
4299 Church Creek Rd
Belcamp, MD 21017
(410) 273-5550
Belcamp, MD 21017
(410) 273-5550
Grades: PK-5
| 722 students
Rank: #31 - 3331. - 33.
Edgewood Elementary School
(Math: 15-19% | Reading: 30-34%)
Rank:
Rank:
4/
Bottom 50%10
2100 Cedar Dr
Edgewood, MD 21040
(410) 612-1540
Edgewood, MD 21040
(410) 612-1540
Grades: PK-5
| 415 students
Rank: #31 - 3331. - 33.
Joppatowne Elementary School
(Math: 21% | Reading: 28%)
Rank:
Rank:
4/
Bottom 50%10
407 Trimble Rd
Joppa, MD 21085
(410) 612-1546
Joppa, MD 21085
(410) 612-1546
Grades: PK-5
| 495 students
Rank: #31 - 3331. - 33.
Riverside Elementary School
(Math: 15-19% | Reading: 30-34%)
Rank:
Rank:
4/
Bottom 50%10
211 Stillmeadow Dr
Joppa, MD 21085
(410) 612-1560
Joppa, MD 21085
(410) 612-1560
Grades: PK-5
| 465 students
Rank: #3434.
Havre De Grace Middle School
(Math: 14% | Reading: 35%)
Rank:
Rank:
4/
Bottom 50%10
445 Lewis Lane
Havre De Grace, MD 21078
(410) 939-6608
Havre De Grace, MD 21078
(410) 939-6608
Grades: 6-8
| 587 students
Rank: #3535.
Bakerfield Elementary School
(Math: 15-19% | Reading: 25-29%)
Rank:
Rank:
4/
Bottom 50%10
36 Baker St
Aberdeen, MD 21001
(410) 273-5518
Aberdeen, MD 21001
(410) 273-5518
Grades: PK-5
| 452 students
Show 10 more public schools in Harford County School District (out of 45 total schools)
Loading...
Recent Articles

The Impact of Coronavirus on 九游体育s
This article discusses the widespread impact of COVID-19 on public schools, addressing issues such as school closures, remote learning challenges, effects on standardized testing, and concerns about student progress. It also provides tips for parents suddenly faced with homeschooling responsibilities.

What 九游体育 Students Should Expect After COVID-19
In this article, we鈥檒l take a closer look at the financial impact of COVID-19 on public schools and what to expect in the future. We鈥檒l talk about the effects of budget cuts and other challenges affecting the public school system for the remainder of this school year and into the next.

February 05, 2025
Understanding the U.S. Department of Education: Structure, Impact, and EvolutionWe explore how the Department of Education shapes American education, from its cabinet-level leadership to its impact on millions of students, written for general audiences seeking clarity on this vital institution.


