Top Rankings
Buncombe County Schools School District ranks among the top 20% of public school district in North Carolina for:
Category
Attribute
Community Size
Largest student body (number of students) (Top 1%)
For the 2025 school year, there are 32 public elementary schools serving 13,335 students in Buncombe County Schools School District. This district's average elementary testing ranking is 6/10, which is in the top 50% of public elementary schools in North Carolina.
Public Elementary Schools in Buncombe County Schools School District have an average math proficiency score of 53% (versus the North Carolina public elementary school average of 50%), and reading proficiency score of 49% (versus the 49% statewide average).
Minority enrollment is 35% of the student body (majority Hispanic), which is less than the North Carolina public elementary school average of 57% (majority Black and Hispanic).
Overview
This School District
This State (NC)
# Schools
45 Schools
2,174 Schools
# Students
22,126 Students
1,091,007 Students
# Teachers
1,549 Teachers
73,903 Teachers
Student : Teacher Ratio
14:1
14:1
District Rank
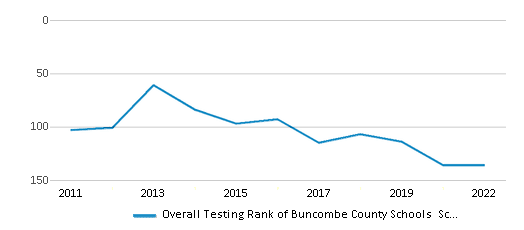
Buncombe County Schools School District, which is ranked within the top 50% of all 320 school districts in North Carolina (based off of combined math and reading proficiency testing data) for the 2021-2022 school year.
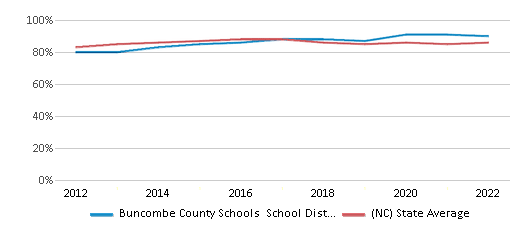
The school district's graduation rate of 90% has increased from 88% over five school years.
Overall District Rank
#136 out of 325 school districts
(Top 50%)
(Top 50%)
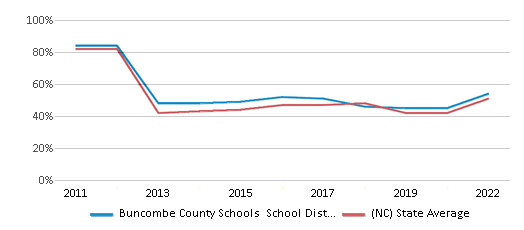
Math Test Scores (% Proficient)
54%
51%
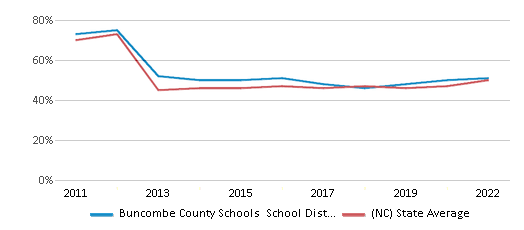
Reading/Language Arts Test Scores (% Proficient)
51%
50%
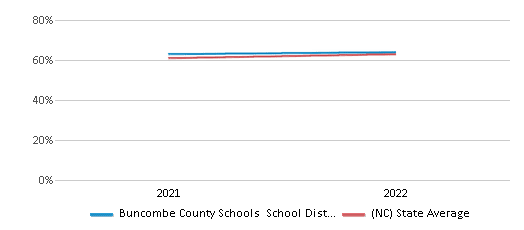
Science Test Scores (% Proficient)
64%
63%
Graduation Rate
90%
86%
Students by Ethnicity:
Diversity Score
0.53
0.72
# American Indian Students
58 Students
12,383 Students
% American Indian Students
n/a
1%
# Asian Students
271 Students
47,310 Students
% Asian Students
1%
4%
# Hispanic Students
4,709 Students
227,576 Students
% Hispanic Students
21%
21%
# Black Students
1,558 Students
268,051 Students
% Black Students
7%
25%
# White Students
14,351 Students
465,086 Students
% White Students
65%
43%
# Hawaiian Students
98 Students
1,488 Students
% Hawaiian Students
1%
n/a
# Two or more races Students
1,127 Students
69,126 Students
% of Two or more races Students
5%
6%
Students by Grade:
# Students in PK Grade:
127
23,192
# Students in K Grade:
1,565
109,971
# Students in 1st Grade:
1,579
114,331
# Students in 2nd Grade:
1,785
118,121
# Students in 3rd Grade:
1,590
111,941
# Students in 4th Grade:
1,740
114,493
# Students in 5th Grade:
1,604
115,565
# Students in 6th Grade:
1,598
116,023
# Students in 7th Grade:
1,659
113,393
# Students in 8th Grade:
1,597
115,504
# Students in 9th Grade:
2,009
11,612
# Students in 10th Grade:
1,884
10,182
# Students in 11th Grade:
1,843
8,704
# Students in 12th Grade:
1,546
7,975
# Ungraded Students:
-
-
District Revenue and Spending
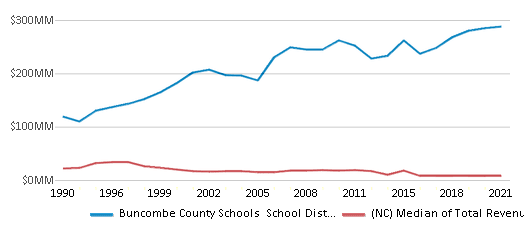
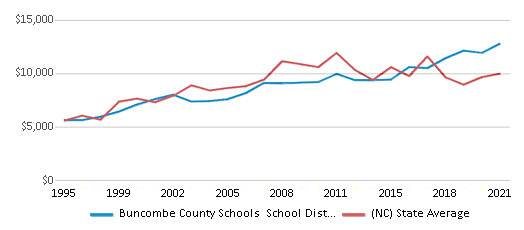
The revenue/student of $13,030 is higher than the state median of $11,187. The school district revenue/student has stayed relatively flat over four school years.
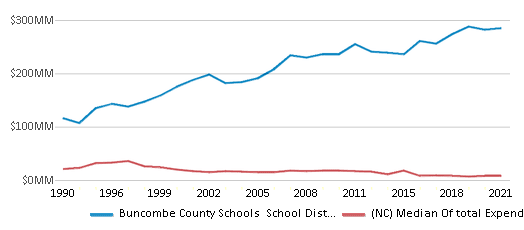
The school district's spending/student of $12,902 is higher than the state median of $11,612. The school district spending/student has stayed relatively flat over four school years.
Total Revenue
$288 MM
$17,307 MM
Spending
$286 MM
$17,964 MM
Revenue / Student
$13,030
$11,187
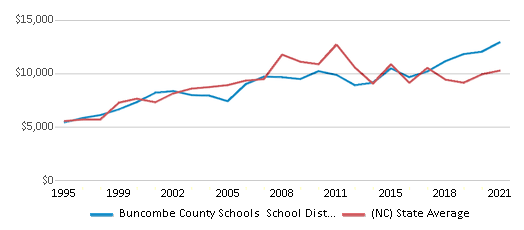
Spending / Student
$12,902
$11,612
Best Buncombe County Schools School District Public Elementary Schools (2025)
School
(Math and Reading Proficiency)
(Math and Reading Proficiency)
Location
Grades
Students
Rank: #11.
Fairview Elementary School
(Math: 73% | Reading: 70%)
Rank:
Rank:
9/
Top 20%10
1355 Charlotte Hwy
Fairview, NC 28730
(828) 628-2732
Fairview, NC 28730
(828) 628-2732
Grades: K-5
| 627 students
Rank: #22.
Weaverville Elementary School
(Math: 74% | Reading: 64%)
Rank:
Rank:
9/
Top 20%10
129 S Main Street
Weaverville, NC 28787
(828) 645-3127
Weaverville, NC 28787
(828) 645-3127
Grades: 2-4
| 322 students
Rank: #33.
Glen Arden Elementary School
(Math: 70-74% | Reading: 55-59%)
Rank:
Rank:
8/
Top 30%10
50 Pinehurst Circle
Arden, NC 28704
(828) 654-1800
Arden, NC 28704
(828) 654-1800
Grades: PK-4
| 471 students
Rank: #44.
Cane Creek Middle School
(Math: 65% | Reading: 62%)
Rank:
Rank:
8/
Top 30%10
570 Lower Brush Creek Road
Fletcher, NC 28732
(828) 628-0824
Fletcher, NC 28732
(828) 628-0824
Grades: 6-8
| 470 students
Rank: #5 - 65. - 6.
Bell Elementary School
(Math: 60-64% | Reading: 60-64%)
Rank:
Rank:
8/
Top 30%10
90 Maple Springs Road
Asheville, NC 28805
(828) 298-3789
Asheville, NC 28805
(828) 298-3789
Grades: PK-5
| 204 students
Rank: #5 - 65. - 6.
Haw Creek Elementary School
(Math: 60-64% | Reading: 60-64%)
Rank:
Rank:
8/
Top 30%10
10 Bethesda Road
Asheville, NC 28805
(828) 298-4022
Asheville, NC 28805
(828) 298-4022
Grades: PK-5
| 394 students
Rank: #77.
West Buncombe Elementary School
(Math: 64% | Reading: 57%)
Rank:
Rank:
8/
Top 30%10
175 Erwin Hills Road
Asheville, NC 28806
(828) 232-4282
Asheville, NC 28806
(828) 232-4282
Grades: K-4
| 578 students
Rank: #88.
North Windy Ridge Intermediate
(Math: 62% | Reading: 58%)
Rank:
Rank:
8/
Top 30%10
20 Doan Road
Weaverville, NC 28787
(828) 658-1892
Weaverville, NC 28787
(828) 658-1892
Grades: 5-6
| 487 students
Rank: #99.
Black Mountain Elementary School
(Math: 55-59% | Reading: 60-64%)
Rank:
Rank:
8/
Top 30%10
100 Flat Creek Road
Black Mountain, NC 28711
(828) 669-5217
Black Mountain, NC 28711
(828) 669-5217
Grades: 4-5
| 150 students
Rank: #1010.
North Buncombe Elementary School
(Math: 60-64% | Reading: 55-59%)
Rank:
Rank:
8/
Top 30%10
251 Flat Creek Church Rd
Weaverville, NC 28787
(828) 645-6054
Weaverville, NC 28787
(828) 645-6054
Grades: PK-4
| 585 students
Rank: #1111.
Pisgah Elementary School
(Math: 65-69% | Reading: 50-54%)
Rank:
Rank:
8/
Top 30%10
1495 Pisgah Hwy
Candler, NC 28715
(828) 670-5023
Candler, NC 28715
(828) 670-5023
Grades: K-4
| 167 students
Rank: #1212.
Estes Elementary School
(Math: 59% | Reading: 57%)
Rank:
Rank:
7/
Top 50%10
275 Overlook Road
Asheville, NC 28803
(828) 654-1795
Asheville, NC 28803
(828) 654-1795
Grades: PK-4
| 790 students
Rank: #1313.
Hominy Valley Elementary School
(Math: 55-59% | Reading: 55-59%)
Rank:
Rank:
7/
Top 50%10
450 Enka Lake Road
Candler, NC 28715
(828) 665-0619
Candler, NC 28715
(828) 665-0619
Grades: K-4
| 428 students
Rank: #1414.
Buncombe County Schools Virtual Academy
(Math: 50-54% | Reading: 60-64%)
Rank:
Rank:
7/
Top 50%10
21 Trinity Chapel Rd, Building
Asheville, NC 28805
(828) 255-5102
Asheville, NC 28805
(828) 255-5102
Grades: K-12
| 280 students
Rank: #1515.
Valley Springs Middle School
(Math: 57% | Reading: 52%)
Rank:
Rank:
7/
Top 50%10
224 Long Shoals Road
Arden, NC 28704
(828) 654-1785
Arden, NC 28704
(828) 654-1785
Grades: 5-8
| 634 students
Rank: #1616.
Black Mountain Primary
(Math: 55-59% | Reading: 45-49%)
Rank:
Rank:
6/
Top 50%10
301 East State Street
Black Mountain, NC 28711
(828) 669-2645
Black Mountain, NC 28711
(828) 669-2645
Grades: PK-3
| 344 students
Rank: #1717.
Candler Elementary School
(Math: 55-59% | Reading: 40-44%)
Rank:
Rank:
6/
Top 50%10
121 Candler School Road
Candler, NC 28715
(828) 670-5018
Candler, NC 28715
(828) 670-5018
Grades: PK-4
| 365 students
Rank: #1818.
Barnardsville Elementary School
(Math: 50-59% | Reading: 40-49%)
Rank:
Rank:
5/
Bottom 50%10
20 Hillcrest Drive
Barnardsville, NC 28709
(828) 626-2290
Barnardsville, NC 28709
(828) 626-2290
Grades: PK-4
| 109 students
Rank: #1919.
Enka Intermediate
(Math: 53% | Reading: 44%)
Rank:
Rank:
5/
Bottom 50%10
125 Asheville Commerce Parkway
Candler, NC 28715
(828) 255-1380
Candler, NC 28715
(828) 255-1380
Grades: 5-6
| 577 students
Rank: #2020.
Koontz Intermediate
(Math: 48% | Reading: 45%)
Rank:
Rank:
5/
Bottom 50%10
305 Overlook Road
Asheville, NC 28803
(828) 684-1295
Asheville, NC 28803
(828) 684-1295
Grades: 5-6
| 680 students
Rank: #2121.
Sand Hill-venable Elementary School
(Math: 49% | Reading: 42%)
Rank:
Rank:
5/
Bottom 50%10
154 Sand Hill School Road
Asheville, NC 28806
(828) 670-5028
Asheville, NC 28806
(828) 670-5028
Grades: PK-4
| 539 students
Rank: #2222.
Avery's Creek Elementary School
(Math: 45% | Reading: 43%)
Rank:
Rank:
4/
Bottom 50%10
15 Park South Boulevard
Arden, NC 28704
(828) 654-1810
Arden, NC 28704
(828) 654-1810
Grades: PK-4
| 565 students
Rank: #2323.
Leicester Elementary School
(Math: 45-49% | Reading: 35-39%)
Rank:
Rank:
4/
Bottom 50%10
31 Gilbert Road
Leicester, NC 28748
(828) 683-2341
Leicester, NC 28748
(828) 683-2341
Grades: PK-4
| 394 students
Rank: #2424.
Reynolds Middle School
(Math: 44% | Reading: 39%)
Rank:
Rank:
4/
Bottom 50%10
2 Rocket Drive
Asheville, NC 28803
(828) 298-7484
Asheville, NC 28803
(828) 298-7484
Grades: 6-8
| 490 students
Rank: #2525.
Owen Middle School
(Math: 38% | Reading: 42%)
Rank:
Rank:
4/
Bottom 50%10
730 Old Us 70
Swannanoa, NC 28778
(828) 686-7739
Swannanoa, NC 28778
(828) 686-7739
Grades: 6-8
| 435 students
Rank: #2626.
Oakley Elementary School
(Math: 40% | Reading: 38%)
Rank:
Rank:
3/
Bottom 50%10
753 Fairview Road
Asheville, NC 28803
(828) 274-7515
Asheville, NC 28803
(828) 274-7515
Grades: PK-5
| 444 students
Rank: #2727.
Eblen Intermediate
(Math: 43% | Reading: 33%)
Rank:
Rank:
3/
Bottom 50%10
59 Lee's Creek Road
Asheville, NC 28806
(828) 255-5757
Asheville, NC 28806
(828) 255-5757
Grades: 5-6
| 550 students
Rank: #2828.
Emma Elementary School
(Math: 40-44% | Reading: 30-34%)
Rank:
Rank:
3/
Bottom 50%10
37 Brickyard Road
Asheville, NC 28806
(828) 232-4272
Asheville, NC 28806
(828) 232-4272
Grades: K-4
| 270 students
Rank: #2929.
Williams Elementary School
(Math: 36% | Reading: 33%)
Rank:
Rank:
3/
Bottom 50%10
161 Bee Tree Road
Swannanoa, NC 28778
(828) 686-3856
Swannanoa, NC 28778
(828) 686-3856
Grades: PK-5
| 465 students
Rank: #3030.
Woodfin Elementary School
(Math: 30-39% | Reading: 30-39%)
Rank:
Rank:
3/
Bottom 50%10
108 Elk Mountain Road
Asheville, NC 28804
(828) 232-4287
Asheville, NC 28804
(828) 232-4287
Grades: K-5
| 115 students
Rank: #3131.
Johnston Elementary School
(Math: 20-24% | Reading: 15-19%)
Rank:
Rank:
1/
Bottom 50%10
230 Johnston Boulevard
Asheville, NC 28806
(828) 232-4291
Asheville, NC 28806
(828) 232-4291
Grades: PK-4
| 184 students
Rank: n/an/a
39 S Main Street
Weaverville, NC 28787
(828) 645-4275
Weaverville, NC 28787
(828) 645-4275
Grades: PK-1
| 222 students
Recent Articles

Sexual Harassment at Age 6: The Tale of a First Grade Suspension
A six-year old in Aurora, Colorado, was suspended after singing an LMFAO song to a little girl in his class and reportedly 鈥渟haking his booty.鈥� We look at the case and the sexual harassment problem in public schools today.

How Scaffolding Could Change the Way Your Child Learns
This article explores the concept of instructional scaffolding, a teaching method that enhances learning by breaking down complex tasks into manageable parts. It highlights how scaffolding supports students in developing critical thinking skills and becoming more independent learners. The article discusses the benefits of scaffolding, including improved engagement and reduced anxiety, and provides strategies for its implementation across various educational levels.

February 05, 2025
Understanding the U.S. Department of Education: Structure, Impact, and EvolutionWe explore how the Department of Education shapes American education, from its cabinet-level leadership to its impact on millions of students, written for general audiences seeking clarity on this vital institution.


