Top Rankings
KIPP Texas School District ranks among the top 20% of public school district in Texas for:
Category
Attribute
Community Size
Largest student body (number of students) (Top 1%)
For the 2025 school year, there are 17 public high schools serving 10,519 students in KIPP Texas School District. This district's average high testing ranking is 5/10, which is in the bottom 50% of public high schools in Texas.
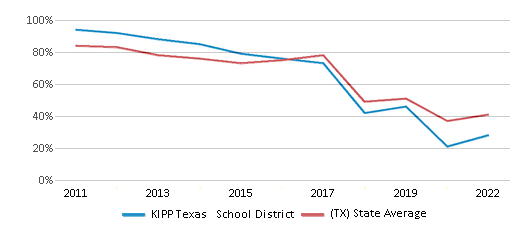
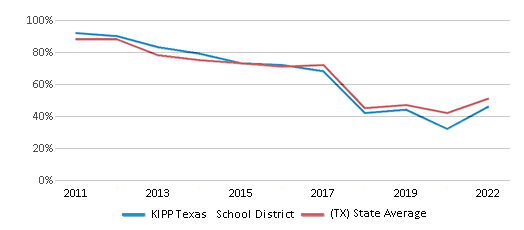
Public High Schools in KIPP Texas School District have an average math proficiency score of 31% (versus the Texas public high school average of 37%), and reading proficiency score of 50% (versus the 47% statewide average).
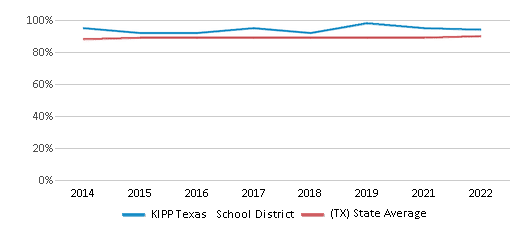
Public High School in KIPP Texas School District have a Graduation Rate of 94%, which is more than the Texas average of 89%.
The school with highest graduation rate is Kipp Austin Collegiate, with ≥95% graduation rate. Read more about public school graduation rate statistics in Texas or national school graduation rate statistics.
Minority enrollment is 98% of the student body (majority Hispanic), which is more than the Texas public high school average of 74% (majority Hispanic).
Overview
This School District
This State (TX)
# Schools
54 Schools
2,552 Schools
# Students
33,445 Students
1,864,677 Students
# Teachers
1,752 Teachers
125,506 Teachers
Student : Teacher Ratio
19:1
19:1
District Rank
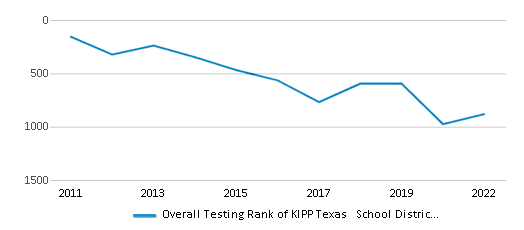
KIPP Texas School District, which is ranked #870 of all 1,196 school districts in Texas (based off of combined math and reading proficiency testing data) for the 2021-2022 school year.
The school district's graduation rate of 94% has increased from 90-94% over five school years.
Overall District Rank
#880 out of 1204 school districts
(Bottom 50%)
(Bottom 50%)
Math Test Scores (% Proficient)
28%
41%
Reading/Language Arts Test Scores (% Proficient)
46%
51%
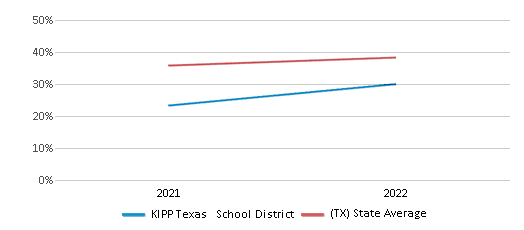
Science Test Scores (% Proficient)
36%
46%
Graduation Rate
94%
90%
Students by Ethnicity:
Diversity Score
0.47
0.64
# American Indian Students
176 Students
6,249 Students
% American Indian Students
1%
n/a
# Asian Students
713 Students
95,920 Students
% Asian Students
2%
5%
# Hispanic Students
22,750 Students
992,082 Students
% Hispanic Students
68%
53%
# Black Students
8,771 Students
234,075 Students
% Black Students
26%
13%
# White Students
644 Students
483,077 Students
% White Students
2%
26%
# Hawaiian Students
14 Students
2,934 Students
% Hawaiian Students
n/a
n/a
# Two or more races Students
377 Students
50,340 Students
% of Two or more races Students
1%
3%
Students by Grade:
# Students in PK Grade:
3,719
6,571
# Students in K Grade:
2,301
9,336
# Students in 1st Grade:
2,381
10,076
# Students in 2nd Grade:
2,414
10,215
# Students in 3rd Grade:
2,391
10,512
# Students in 4th Grade:
2,341
10,681
# Students in 5th Grade:
2,445
11,658
# Students in 6th Grade:
2,689
32,105
# Students in 7th Grade:
2,672
38,290
# Students in 8th Grade:
2,645
40,744
# Students in 9th Grade:
2,374
472,263
# Students in 10th Grade:
2,002
438,622
# Students in 11th Grade:
1,718
406,207
# Students in 12th Grade:
1,353
367,397
# Ungraded Students:
-
-
District Revenue and Spending
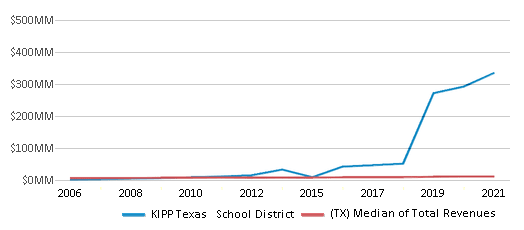
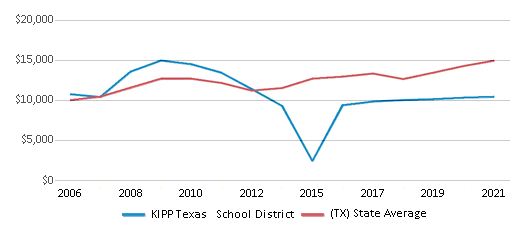
The revenue/student of $12,021 in this school district is less than the state median of $13,387. The school district revenue/student has declined by 6% over four school years.
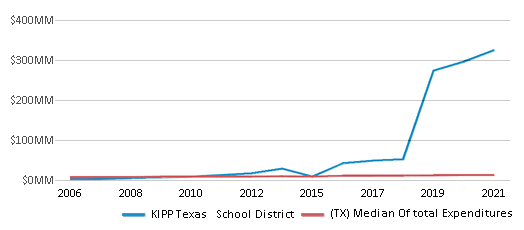
The school district's spending/student of $9,717 is less than the state median of $14,116. The school district spending/student has declined by 6% over four school years.
Total Revenue
$402 MM
$74,029 MM
Spending
$325 MM
$78,063 MM
Revenue / Student
$12,021
$13,387

Spending / Student
$9,717
$14,116
Best KIPP Texas School District Public High Schools (2025)
School
(Math and Reading Proficiency)
(Math and Reading Proficiency)
Location
Grades
Students
Rank: #11.
Kipp Sharpstown College Prep
Charter School
(Math: 57% | Reading: 68%)
Rank:
Rank:
9/
Top 20%10
8440 Westpark Dr
Houston, TX 77063
(281) 879-3005
Houston, TX 77063
(281) 879-3005
Grades: 6-10
| 650 students
Rank: #22.
Kipp Academy West
Charter School
(Math: 47% | Reading: 62%)
Rank:
Rank:
8/
Top 30%10
15022 Old Richmond Rd
Sugar Land, TX 77498
(832) 230-0573
Sugar Land, TX 77498
(832) 230-0573
Grades: 6-9
| 395 students
Rank: #33.
Kipp Connect Preparatory
Charter School
(Math: 47% | Reading: 61%)
Rank:
Rank:
8/
Top 30%10
6700 Bellaire Blvd
Houston, TX 77074
(281) 879-3023
Houston, TX 77074
(281) 879-3023
Grades: 6-12
| 927 students
Rank: #44.
Kipp Houston High School
Charter School
(Math: 40-44% | Reading: 64%)
Rank:
Rank:
8/
Top 30%10
10711 Kipp Way St
Houston, TX 77099
(832) 328-1051
Houston, TX 77099
(832) 328-1051
Grades: 9-12
| 657 students
Rank: #55.
Kipp Journey Collegiate School
Charter School
(Math: 38% | Reading: 56%)
Rank:
Rank:
6/
Top 50%10
14030 Florence Rd
Sugar Land, TX 77498
(281) 900-0490
Sugar Land, TX 77498
(281) 900-0490
Grades: 6-10
| 585 students
Rank: #66.
Kipp Pleasant Grove Leadership Academy
Charter School
(Math: 32% | Reading: 41%)
Rank:
Rank:
3/
Bottom 50%10
1500 S Peachtree Rd
Balch Springs, TX 75180
(972) 323-4235
Balch Springs, TX 75180
(972) 323-4235
Grades: 6-11
| 642 students
Rank: #77.
Kipp Mosaic Academy School
Charter School
(Math: 26% | Reading: 46%)
Rank:
Rank:
3/
Bottom 50%10
12751 Hillcroft Ave
Houston, TX 77085
(281) 879-3110
Houston, TX 77085
(281) 879-3110
Grades: 5-9
| 771 students
Rank: #88.
Kipp Generations Collegiate
Charter School
(Math: 15% | Reading: 50%)
Rank:
Rank:
3/
Bottom 50%10
500 Tidwell Rd
Houston, TX 77022
(832) 230-0566
Houston, TX 77022
(832) 230-0566
Grades: 9-12
| 584 students
Rank: #99.
Kipp Somos Collegiate
Charter School
(Math: 15-19% | Reading: 45-49%)
Rank:
Rank:
3/
Bottom 50%10
8915 Callaghan Rd
San Antonio, TX 78230
(210) 544-2791
San Antonio, TX 78230
(210) 544-2791
Grades: 6-12
| 630 students
Rank: #1010.
Kipp Austin Collegiate
Charter School
(Math: 14% | Reading: 48%)
Rank:
Rank:
3/
Bottom 50%10
8004 Cameron Rd
Austin, TX 78754
(512) 501-3586
Austin, TX 78754
(512) 501-3586
Grades: 9-12
| 823 students
Rank: #1111.
Kipp East End High School
Charter School
(Math: 15-19% | Reading: 46%)
Rank:
Rank:
3/
Bottom 50%10
5402 Lawndale St
Houston, TX 77023
(281) 879-3100
Houston, TX 77023
(281) 879-3100
Grades: 9-12
| 601 students
Rank: #1212.
Kipp University Prep High School
Charter School
(Math: 15% | Reading: 42%)
Rank:
Rank:
2/
Bottom 50%10
239 Stark St
San Antonio, TX 78204
(210) 290-8720
San Antonio, TX 78204
(210) 290-8720
Grades: 9-12
| 734 students
Rank: #1313.
Kipp Sunnyside High School
Charter School
(Math: 15-19% | Reading: 39%)
Rank:
Rank:
2/
Bottom 50%10
11000 Scott St
Houston, TX 77047
(832) 230-0562
Houston, TX 77047
(832) 230-0562
Grades: 9-12
| 605 students
Rank: #1414.
Kipp Austin Brave
Charter School
(Math: 14% | Reading: 40%)
Rank:
Rank:
2/
Bottom 50%10
5107 S Ih 35 Frontage Rd
Austin, TX 78744
(512) 651-2225
Austin, TX 78744
(512) 651-2225
Grades: 9-12
| 581 students
Rank: #1515.
Kipp Northeast College Preparatory
Charter School
(Math: 10% | Reading: 41%)
Rank:
Rank:
2/
Bottom 50%10
9680 Mesa Dr
Houston, TX 77078
(832) 230-0567
Houston, TX 77078
(832) 230-0567
Grades: 9-12
| 579 students
Rank: #1616.
Kipp Paseo Preparatory School
Charter School
(Math: 18% | Reading: 33%)
Rank:
Rank:
1/
Bottom 50%10
6800 Metropolis Dr
Austin, TX 78744
(512) 921-5707
Austin, TX 78744
(512) 921-5707
Grades: 5-9
| 436 students
Rank: #1717.
Kipp Oak Cliff Academy
Charter School
(Math: 10-14% | Reading: 20-24%)
Rank:
Rank:
1/
Bottom 50%10
3837 Simpson Stuart Rd
Dallas, TX 75241
(972) 323-4240
Dallas, TX 75241
(972) 323-4240
Grades: 9-12
| 319 students
Recent Articles

Year-Round Or Traditional Schedule?
Which is more appropriate for your child? A year-round attendance schedule or traditional schedule? We look at the pros and cons.

Why You Should Encourage Your Child to Join a Sports Team
Participating in team sports has a great many benefits for children, there is no doubt. In this article you will learn what those benefits are.

White Students are Now the Minority in U.S. 九游体育s
Increasing birth rates among immigrant families from Asia and Central and South America, combined with lower birth rates among white families, means that for the first time in history, public school students in the United States are majority-minority. This shift in demographics poses difficulties for schools as they work to accommodate children of varying language abilities and socio-economic backgrounds.


